Phase 11b — Pennant strategy backtest across 5 detection scenarios¶
Stock-only backtest of the production pennant strategy applied to each
of the five detection criteria scenarios from Phases 11a / 11a-2 /
11a-3. Detection events came from the cached parquets under ab_test/;
no detection runs were re-executed. No production code, config, or data
modified.
1. Setup¶
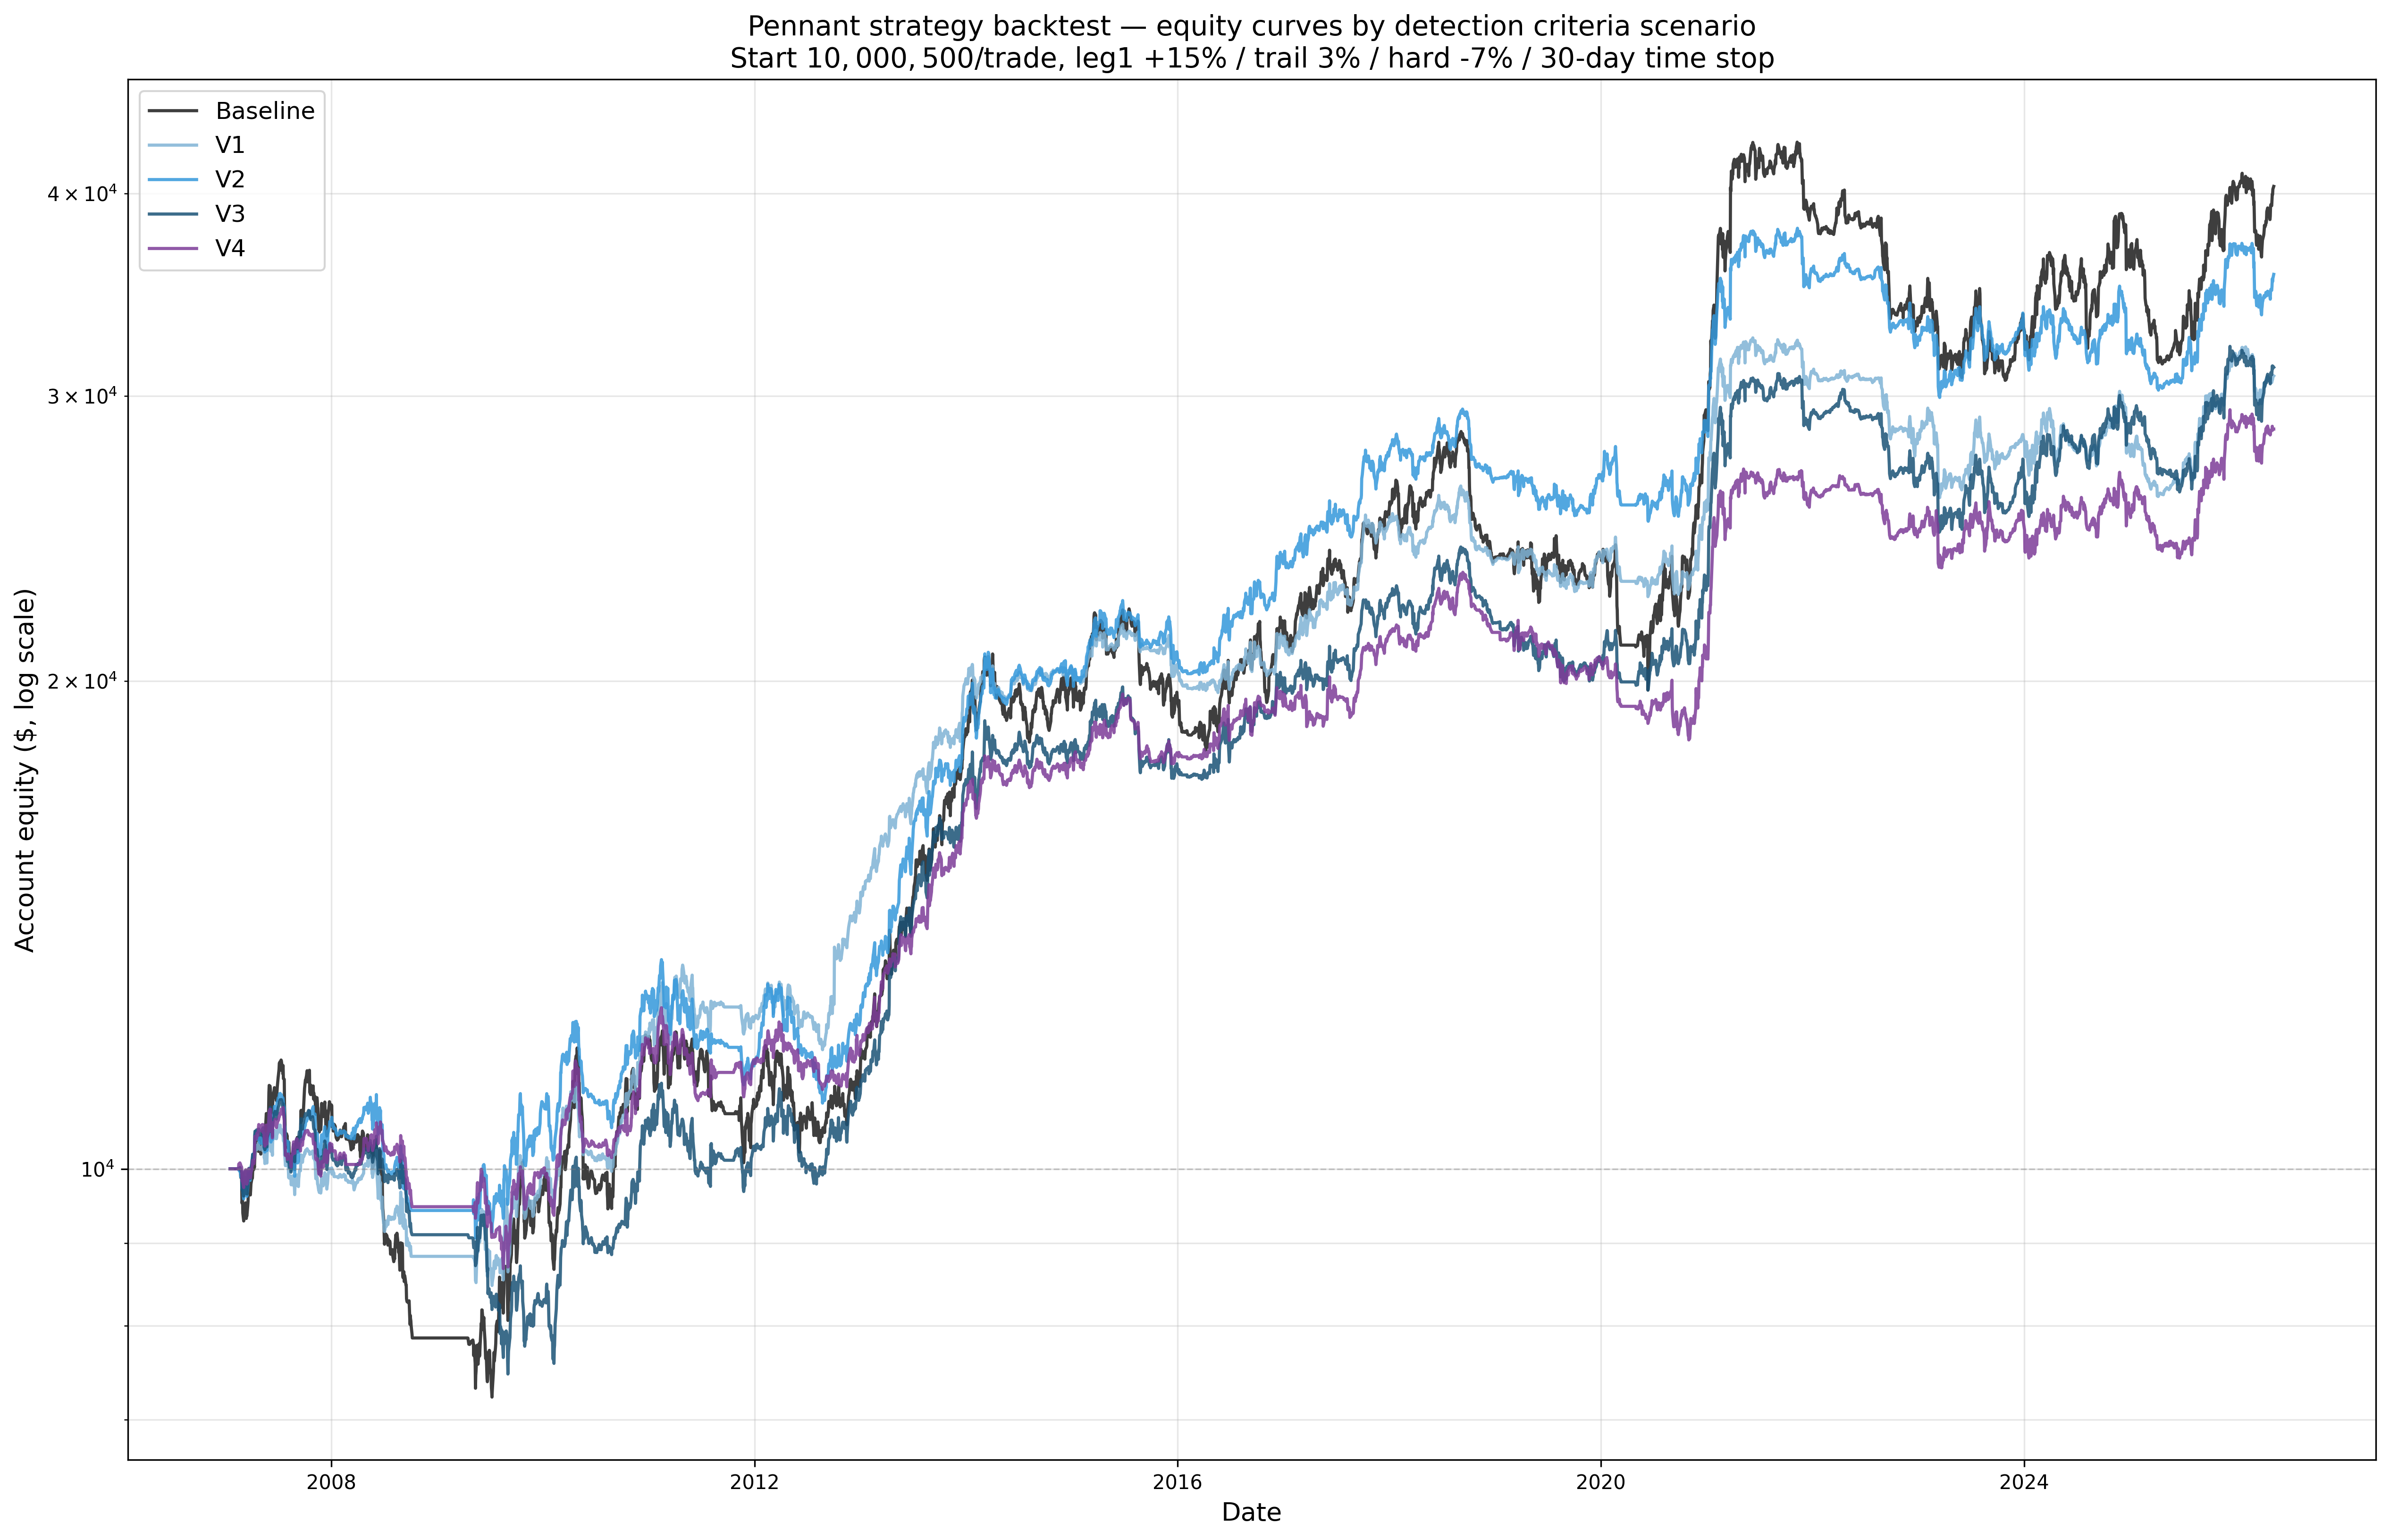
Five scenarios — Baseline (current production: pennant 5–15, flagpole 1–10), V1 (pennant 10–20, flagpole 1–5), V2 (pennant 7–17, flagpole 1–5), V3 (pennant 6–17, flagpole 1–3), V4 (pennant 6–17, flagpole 1–2) — were each simulated independently. Each scenario started with $10,000 cash, took $500 nominal per trade at the anchor close, sold half on a +15 % move, trailed the remainder by 3 % from the in-trade high, hard-stopped at −7 % from entry, and time-stopped after 30 trading days. The regime gate skipped entries on days where SPY < SPY 200-SMA and VIX > 35 (240 such days in the calendar). Friction: $0.50 per fill commission, ±5 bp slippage. Cash was held un-invested; fractional shares allowed; concurrency capped only by available cash. Detection events were taken in chronological order; if cash on the entry date was < $500 the candidate was skipped ("no_cash"), not back-filled.
All five scenarios share the same strategy mechanics, prices, calendar, and regime gate — the only difference is the detection parameters that produced the event population.
2. End-of-year equity¶
| Year | Baseline | V1 | V2 | V3 | V4 |
|---|---|---|---|---|---|
| 2007 start | $10,000 | $10,000 | $10,000 | $10,000 | $10,000 |
| 2007 EOY | $10,956 | $9,988 | $10,687 | $10,306 | $10,320 |
| 2008 EOY | $7,864 | $8,831 | $9,426 | $9,106 | $9,476 |
| 2009 EOY | $9,640 | $9,915 | $10,939 | $8,249 | $9,959 |
| 2010 EOY | $11,936 | $12,042 | $12,662 | $10,584 | $11,873 |
| 2011 EOY | $10,896 | $12,362 | $11,575 | $10,278 | $11,614 |
| 2012 EOY | $11,441 | $14,533 | $12,352 | $11,129 | $11,833 |
| 2013 EOY | $18,692 | $20,071 | $18,989 | $17,391 | $16,766 |
| 2014 EOY | $19,978 | $20,398 | $20,382 | $18,291 | $17,898 |
| 2015 EOY | $19,413 | $20,280 | $20,620 | $17,612 | $17,995 |
| 2016 EOY | $21,353 | $21,036 | $23,630 | $19,702 | $19,301 |
| 2017 EOY | $25,242 | $25,010 | $27,536 | $22,403 | $21,323 |
| 2018 EOY | $23,851 | $23,711 | $26,683 | $21,732 | $21,433 |
| 2019 EOY | $23,874 | $23,927 | $26,818 | $20,664 | $20,556 |
| 2020 EOY | $29,101 | $25,870 | $28,795 | $23,098 | $20,919 |
| 2021 EOY | $39,232 | $31,005 | $35,856 | $29,278 | $26,185 |
| 2022 EOY | $33,488 | $28,418 | $32,553 | $26,605 | $24,725 |
| 2023 EOY | $33,089 | $28,206 | $33,035 | $26,840 | $25,060 |
| 2024 EOY | $36,010 | $27,667 | $32,107 | $28,545 | $25,336 |
| 2025 EOY | $39,865 | $31,565 | $36,779 | $31,334 | $28,504 |
| 2026 YTD (2026-05-11) | $40,398 | $30,858 | $35,651 | $31,240 | $28,615 |
3. Headline metrics¶
| Scenario | Final equity | Total return | CAGR | Max DD | Sharpe | Trades | Skipped no-cash | Win rate |
|---|---|---|---|---|---|---|---|---|
| Baseline | $40,398 | +304 % | 7.50 % | −38.1 % | 0.543 | 8,842 | 6,573 | 43.7 % |
| V1 | $30,858 | +209 % | 6.01 % | −20.4 % | 0.609 | 4,533 | 591 | 45.1 % |
| V2 | $35,651 | +257 % | 6.80 % | −21.4 % | 0.617 | 6,108 | 1,272 | 44.7 % |
| V3 | $31,240 | +212 % | 6.08 % | −32.3 % | 0.547 | 5,200 | 1,070 | 45.0 % |
| V4 | $28,615 | +186 % | 5.59 % | −21.2 % | 0.580 | 4,101 | 511 | 45.4 % |
Regime gate blocked 24 – 106 entries per scenario (0.5 – 1.2 % of candidates) — the gate is a small effect at this timescale.
4. Interpretation¶
Absolute return: Baseline wins, then V2. Baseline finishes at $40,398 vs V2's $35,651, with V1 and V3 closely tied around $31k and V4 last at $28,615. Baseline simply gets to take more trades — 8,842 filled trades vs V2's 6,108, vs V4's 4,101 — and on $500 fixed sizing that compounds into more raw return. Roughly $9.5k of Baseline's $10.4k lead over V4 traces directly to taking 4,741 more entries.
Risk-adjusted: V2 wins, then V1. Baseline pays for its higher volume with the worst drawdown in the field (−38 %, vs V1's −20 % and V2's −21 %) and the lowest Sharpe (0.543). V2 captures most of Baseline's compounding (CAGR 6.80 % vs 7.50 %) with about half the drawdown — Sharpe 0.617 is the best of the five. V1 is close behind at 0.609 with the tightest drawdown (−20.4 %). V3 lands at Baseline's Sharpe but with a noticeably worse drawdown than V2/V4.
Cash utilization tells the story. Baseline's 6,573 no-cash skips (42 % of candidates!) show capital is constantly fully deployed — buying every $500 slot it can. V2 skips only 1,272 (17 %), V4 skips just 511 (11 %). The variant detectors send fewer candidates so cash sits idle more often; that idle cash is the drag against Baseline on absolute return, but it's also the buffer that produces the smaller drawdowns.
Year-by-year, the ranking flips repeatedly. In 2008 the order was V4 > V2 > V3 > V1 > Baseline — the variants survived the crash with less capital deployed in falling stocks. By 2012, V1 led the field (+45 % vs Baseline +14 %). V2 had the lead from 2016 through 2020 (stronger pole-quality screen helped through choppy mid-2010s). The 2021–2024 bull rotated Baseline back to the front as raw count mattered more than per-trade quality. V3 has trailed V1 for most of the run and never recovered the early 2009 drawdown gap. V4 has trailed throughout, consistent with the Phase 11a-3 finding that flagpole.max = 2 trims too aggressively.
Win rate alone is not the discriminator. All five scenarios sit between 43.7 % and 45.4 % — a 1.7 pp spread. V4 has the highest win rate but the lowest CAGR, because its trades pay less per win (consistent with §6 of the Phase 11a-3 report: V4's 30-day endpoint mean is the only one below baseline). The lever moving the equity curve here is trade count × average profit, not win-rate.
The decision the numbers frame is whether to optimise for absolute compounding (Baseline) or for risk-adjusted compounding (V2). V2 gives up ~$4.7k in final equity over 19 years (~$250/year) in exchange for cutting peak-to-trough drawdown nearly in half. El Don decides.
Artifacts under ab_test/:
backtest.py, plot_backtest.py, backtest.log, backtest_summary.json,
backtest_eoy.csv, plus backtest_trades_<scenario>.parquet and
backtest_equity_<scenario>.parquet for all 5 scenarios.
Chart: charts/pennant_strategy_backtest_equity_curves_2026-05-11.png (300 dpi).